The carbon footprint paradox nobody in the boardroom wants to hear.
The next time someone in a strategy meeting says “bio-based is better for the planet,” ask them one question: better according to what?
Not according to their supplier’s marketing deck. Not according to the sustainability report that earned a press release. According to a cradle-to-gate life cycle assessment with verified emission factors, transparent system boundaries, and an honest accounting of upstream agriculture, energy inputs, and conversion efficiency.
Because when we ran those numbers across three separate industrial engagements, three different sectors, different “sustainable” feedstocks, the results didn’t just challenge assumptions. They demolished them.
In one engagement, the fossil-based production route emitted significantly less CO₂ than the bio-based alternative the client had planned to invest in. In another, a waste feedstock marketed as “circular” and “zero-carbon” produced a carbon footprint so catastrophic it exceeded the fossil baseline by an order of magnitude. And in a third, a technology the client assumed would fail regulatory sustainability requirements turned out to be the only pathway that qualified.
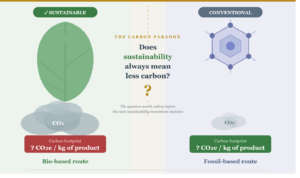
The uncomfortable truth is this: sustainability and carbon footprint are not the same thing. They never were. And confusing the two is costing companies millions in misallocated R&D, stranded capital, and strategic exposure.
This Is Not a Fringe Finding. The Data Is Piling Up.
A November 2025 report by Cerulogy, commissioned by Transport & Environment (T&E), found that global biofuels production emits 16% more CO₂ on average than the fossil fuels it replaces. By 2030, biofuels are projected to emit 70 MtCO₂e more than fossil fuels, equivalent to the annual emissions of nearly 30 million diesel cars.
A 2022 study in the Proceedings of the National Academy of Sciences concluded that U.S. corn-based ethanol is at least 24% more carbon-intensive than gasoline once land use changes and full production-cycle emissions are counted.
A peer-reviewed LCA in the Journal of Surfactants and Detergents found that petrochemical-derived fatty alcohol has lower average greenhouse gas emissions than its palm kernel oil-derived counterpart, the exact opposite of what most procurement teams assume.
A meta-analysis in Nature Communications examining 98 bio-based products found that environmental performance varied enormously, with several bio-based products performing worse than fossil counterparts across multiple impact categories.
These aren’t outliers. They’re a pattern. And the companies making feedstock and process decisions worth tens of millions of dollars without this level of rigour are the ones most exposed.
Where We Saw It First-Hand
We don’t just read the literature. We run the numbers for clients making real capital allocation decisions. Three recent engagements illustrate the pattern with uncomfortable clarity.
When “Bio-Based” Lost to Fossil by Nearly 50%
A global surfactant and speciality chemicals company asked us to evaluate which production route for fatty alcohols carried the lowest carbon footprint. They assumed bio-based palm kernel oil would win. Their procurement strategy was built on that assumption.
We assessed four primary routes across 30+ individual conversion pathways for bio-based oils, captured CO₂, waste feedstocks, and conventional fossil using a five-step proprietary LCA methodology: process identification, decomposition into unit operations, step-level emission calculation, pathway aggregation, and sensitivity analysis across electricity sources and land use scenarios.
The fossil-based routes delivered one of the lowest and most consistent carbon footprints across every pathway we evaluated. The bio-based route came in significantly higher, driven not by conversion chemistry, but by upstream agriculture.
The result? The client scrapped a planned blanket transition to bio-based inputs and adopted a pathway-selective strategy prioritising only those bio-based and circular routes that demonstrably outperformed the fossil baseline on verified emissions data.
The E-Fuel That Qualified and the “Green” One That Didn’t
A European engineering company evaluating entry into the e-fuel value chain needed to know whether electrified reverse water-gas shift (e-RWGS) technology was the optimal route for producing sustainable aviation fuel and e-methanol.
We benchmarked e-RWGS against five competing syngas production technologies: SOEC, biomass gasification, steam methane reforming, electrified SMR, and direct CO₂ hydrogenation on emissions intensity, carbon efficiency, energy consumption, and regulatory compliance across 40+ countries’ SAF blending mandates.
E-RWGS demonstrated the strongest performance profile: lowest emissions, highest carbon efficiency, lowest energy consumption. But the finding that reshaped the client’s strategy wasn’t the performance ranking. It was the regulatory analysis. Electrified SMR, despite using renewable electricity, does not qualify as RFNBO under EU RED II/III because its feedstock, natural gas, introduces new fossil carbon into the system. A technology can be “electrified,” “clean,” and still fail the sustainability test that matters for market access.
Meanwhile, e-RWGS with biogas-derived CO₂ and green hydrogen met every RFNBO criterion, including compliance with the ReFuelEU Aviation mandate requiring e-SAF to reach 35% of all SAF by 2050. The client locked in their technology pathway with regulatory certainty that their competitors, who hadn’t done this analysis, didn’t have.
The “Zero-Carbon” Waste Feedstock That Wasn’t
A global consumer goods company was planning to invest in waste-derived feedstocks for their circular economy strategy. The logic seemed airtight: waste carries zero upstream carbon allocation in most LCA frameworks, so anything made from waste should have a lower carbon footprint than anything made from fossil. Right?
We modelled complete mass and energy balances for each waste-to-chemical pathway, calculated target-product yields per unit of waste processed and benchmarked every route against the fossil-derived equivalent.
The results varied by more than 50x between the best and worst waste pathway. Some waste streams converted efficiently and competed head-to-head with fossil baselines. Others, despite their “free” and “circular” carbon credentials, delivered catastrophic footprints because the concentration of the target chemical in the waste stream was so low that enormous energy inputs were required per kilogram of useful product.
Conversion efficiency, not feedstock origin, was the dominant driver of carbon performance. The client had been weeks away from committing R&D resources to a route that would have increased their portfolio’s carbon footprint. We redirected that investment to pathways with genuine, verified carbon advantages.
 The Paradox Shows Up Everywhere
This is not limited to chemicals. The sustainability-carbon gap appears across sectors:
- Electric vehicles. Manufacturing an EV produces roughly 46% of its lifetime emissions at the production stage versus 26% for an ICE vehicle. In regions with high-carbon grids, BEVs can have higher lifecycle footprints than conventional cars. The “green” vehicle is only green when charged from a green grid.
- Packaging. Industry LCA tools assess virgin paper as having a lower carbon footprint than recycled paper. One study found adding 10% post-consumer recycled fibre increased the carbon footprint by 16% due to additional processing.
- Hydrogen. A study in Green Chemistry found that green hydrogen from wind achieves 0.6 kg CO₂ eq./kg H₂, but green hydrogen from coal-heavy grid electricity can emit more than grey hydrogen from natural gas. The colour label tells you the production method, not the carbon intensity.
What This Demands
If you’re an R&D director, innovation head, or sustainability lead at a chemicals, energy, or materials company, the implications are direct:
You cannot rely on feedstock labels to make carbon decisions. “Bio-based,” “circular,” “CO₂-derived” these describe where your carbon comes from. They say nothing about how much CO₂ your process emits. The only reliable answer is a route-specific LCA.
You must model conversion efficiency before committing capital. A 2% yield from a waste feedstock means 50x more processing per unit of product and 50x more energy, catalyst, and solvent demand. The mass balance decides the carbon outcome, not the marketing story.
Energy source is the single most powerful lever. Across every engagement, switching from grid electricity to renewable energy reduced footprints by 20–90%. For CCU pathways, renewable energy combined with biogenic CO₂ mattered more than changing the chemistry.
Regulatory sustainability and carbon math are not the same thing. Under EU RED II/III, a fuel can have a lower carbon footprint yet fail to qualify as RFNBO because its feedstock introduces new fossil carbon. Companies optimising for carbon alone may find themselves on the wrong side of blending mandates worth billions.
The Atmosphere Doesn’t Read Your Sustainability Report
It doesn’t care about your labels, your certifications, or your press release. It counts molecules.
The companies that will lead in the next decade are not the ones switching to “green” feedstocks and declaring victory. They’re the ones running the numbers rigorously, honestly, route by route and making decisions that are lower-emission, in fact, not just in name.
This is what we do at Researchwire.
The collision of sustainability claims and real-world carbon data is exactly the kind of complex, cross-domain challenge that requires deep technical and scientific intelligence, not just instinct or assumptions.
Our Sustainability & Carbon Advisory practice helps R&D teams, innovation heads, and strategy leaders at chemicals, energy, and materials companies navigate carbon decisions with the same rigour they apply to every other engineering decision in their product portfolio:
→ Route-Specific Life Cycle Assessment (LCA): Cradle-to-gate and cradle-to-grave carbon footprint calculations across multiple production pathways, with verified emission factors and transparent system boundaries.
→ Techno-Economic Assessment (TEA) with Carbon Integration: Combined economic and environmental modelling that identifies pathways that are both commercially viable and genuinely lower-carbon because a pathway that saves CO₂ but destroys margin isn’t a strategy.
→ Feedstock & Process Carbon Benchmarking: Comparative carbon intensity analysis across feedstocks, geographies, and energy scenarios designed to challenge assumptions and surface non-obvious optima.
→ Regulatory & Compliance Mapping: Analysis of sustainability regulations (EU RED II/III, RFNBO, CBAM, CSRD) to determine which production pathways qualify under current and forthcoming mandates before you discover the gap in a courtroom or an audit.
→ Carbon Strategy Advisory: Strategic guidance on where to focus decarbonisation investment for maximum verified impact based on LCA evidence, not marketing narratives.
If your process touches a feedstock and it does, your carbon exposure deserves the same rigour you apply to every other decision in the product.
✍️ Article by Garvita